GPS: Unterschied zwischen den Versionen
Aus www.wiki.ardumower.de
(→Visualization of GPS data) |
(→Visualization of GPS data) |
||
| Zeile 22: | Zeile 22: | ||
<gallery> | <gallery> | ||
File: gpsplot.jpg | File: gpsplot.jpg | ||
| − | File: gpsplotting.jpg | GPS plot | + | File: gpsplotting.jpg | GPS plot (heading/speed via doppler) |
File: gpstracking.jpg | GPS 2d map (tracked perimeter) | File: gpstracking.jpg | GPS 2d map (tracked perimeter) | ||
</gallery> | </gallery> | ||
Version vom 27. Februar 2015, 20:25 Uhr
Inhaltsverzeichnis
Abstract


With the help of a GPS receiver (e.g. GY-NEO6MV2, ublox 6m), the long-term position can be calculated. Therefore, the GPS position values will be averaged.
Currently, GPS is used
- to receive current date and time
Wiring:
GPS TX (3.3V compatible) -- Arduino RX
GPS RX (3.3V compatible) -- Arduino TX
GPS VCC -- Arduino VCC 5V
GPS GND -- Arduino GND
Visualization of GPS data
GPS data (course, speed, position etc.) can be plotted by pfodApp:
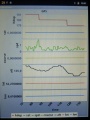
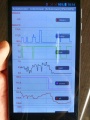
GPS plot (heading/speed via doppler)
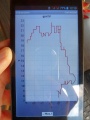
GPS 2d map (tracked perimeter)


GPS error
Typical GPS error is 2-5 meters (at a sample rate of 1 Hz). As this is not sufficient as a replacement for a perimeter wire, GPS can only be seen as an extension or for global navigation (navigation from one lawn to another lawn) or to improve the result of a sensor fusion.